Parametric: Mean in Multiple Groups
Aly Lamuri
Indonesia Medical Education and Research Institute
Overview
- One-way ANOVA
- Two-way ANOVA
- Repeated measure ANOVA
- Post-Hoc analysis
- Effect size
One-Way ANOVA
- A generalization of two-sample T-Test
- We can consider multiple groups at once
- What does one-way mean?
- Follows an F-distribution
- One-way refer to how many group we use as a reference to separate the data
- We will see on the next section how to perform ANOVA if we have multiple grouping variables
- In such cases, we are conducting two-way ANOVA / often referred as factorial ANOVA
- Use sum of square to measure within and between differences
- The denominator is a residual
One-Way ANOVA
- A generalization of two-sample T-Test
- We can consider multiple groups at once
- What does one-way mean?
- Follows an F-distribution
Hypothesis
- \(H_0:\) The population mean of all groups are all equal
- \(H_a:\) The population mean of all groups are not all equal
Please notice the slight difference between are not all equal and are all unequal
One-Way ANOVA
- A generalization of two-sample T-Test
- We can consider multiple groups at once
- What does one-way mean?
- Follows an F-distribution
Statistics
$$F = \frac{\displaystyle \sum_{j=1}^{k} n_j (\bar{X}_j - \bar{X})^2 / (k-1)}{\displaystyle \sum_{j=1}^k \sum_{i=1}^N (X_i - \bar{X}_j)^2 / (N-k)}$$
- \(\bar{X}_j:\) Mean of a group
- \(\bar{X}:\) Mean of all sampled groups
- F-Test is a quotient of between to within differences, both measured as mean squared
- Mean square is the sum square divided by the degree of freedom
- \(\nu = k-1\) for between comparison and \(\nu = N-k\) for within comparison
- \(k\): Number of groups
- \(N\): total number of sample
One-Way ANOVA
- A generalization of two-sample T-Test
- We can consider multiple groups at once
- What does one-way mean?
- Follows an F-distribution
Assumptions
- I.I.D
- Normally distributed
- Homogeneity of variance
- Shapiro-Wilk test
- Levene's test
F-Distribution
- Define a ratio of two variances
- Derived from the \(\chi^2\) distribution
Concept recall: \(\chi^2\) distribution comes from a gamma distribution
F-Distribution
- Define a ratio of two variances
- Derived from the \(\chi^2\) distribution
\begin{align} P(X=x) & = \frac{(\frac{r_1}{r_2})^{\frac{r_1}{2}} \Gamma[(r_1 + r_2) / 2] x^{\frac{r_1}{2}-1}}{\Gamma(\frac{r_1}{2}) \Gamma(\frac{r_2}{2}) [1 + (\frac{r_1 \cdot x}{r_2})]^{\frac{(r_1+r_2)}{2}}} \\ X & \sim F(r_1, r_2) \\ F & = \frac{U / r_1}{V / r_2} \end{align}
Concept recall: \(\chi^2\) distribution comes from a gamma distribution
- \(r_i\) is the degree of freedom
- \(U\) and \(V\) are \(\chi^2\) distribution
Relationship with the T-Test
- Their statistics follow different probability function
- But they have similar aim, i.e. to measure mean differences
- Remember how \(X^2 \sim \chi^2(1) : X \sim N(0, 1)\)?
- It turned out: \(T^2 = F\)*
*Terms and conditions applied
- \(T^2=F\) only happens when we have a two-sample T-Test with equal variance. In other cases, \(T^2 \neq F\).
- F-distribution is a derivation of Gamma and \(\chi^2\) distribution
- While T-distribution is a derivation of a standardized normal distribution
Example, please?
- Throughout the lecture, we will use example datasets from
R - For this example, we are using a
PlantGrowthdatasset - It simply describes dried plants weight measured in multiple groups
- Group: control (
ctrl), treatment 1 (trt1), treatment 2 (trt2)
Example, please?
Initial inspection
# Data structurestr(PlantGrowth)## 'data.frame': 30 obs. of 2 variables:## $ weight: num 4.17 5.58 5.18 6.11 4.5 4.61 5.17 4.53 5.33 5.14 ...## $ group : Factor w/ 3 levels "ctrl","trt1",..: 1 1 1 1 1 1 1 1 1 1 ...# Descriptive statisticswith(PlantGrowth, tapply(weight, group, summary)) %>% {do.call(rbind, .)}## Min. 1st Qu. Median Mean 3rd Qu. Max.## ctrl 4.17 4.55 5.15 5.03 5.29 6.11## trt1 3.59 4.21 4.55 4.66 4.87 6.03## trt2 4.92 5.27 5.44 5.53 5.73 6.31Example, please?
Assumption checks
with(PlantGrowth, tapply(weight, group, shapiro.test)) %>% lapply(broom::tidy) %>% lapply(data.frame) %>% {do.call(rbind, .)}## statistic p.value method## ctrl 0.957 0.747 Shapiro-Wilk normality test## trt1 0.930 0.452 Shapiro-Wilk normality test## trt2 0.941 0.564 Shapiro-Wilk normality testcar::leveneTest(weight ~ group, data=PlantGrowth)## Levene's Test for Homogeneity of Variance (center = median)## Df F value Pr(>F)## group 2 1.12 0.34## 27Example, please?
Perform ANOVA
aov.res1 <- aov(weight ~ group, data=PlantGrowth)anova(aov.res1)## Analysis of Variance Table## ## Response: weight## Df Sum Sq Mean Sq F value Pr(>F) ## group 2 3.77 1.883 4.85 0.016 *## Residuals 27 10.49 0.389 ## ---## Signif. codes: 0 '***' 0.001 '**' 0.01 '*' 0.05 '.' 0.1 ' ' 1Example, please?
Evaluate model goodness of fit
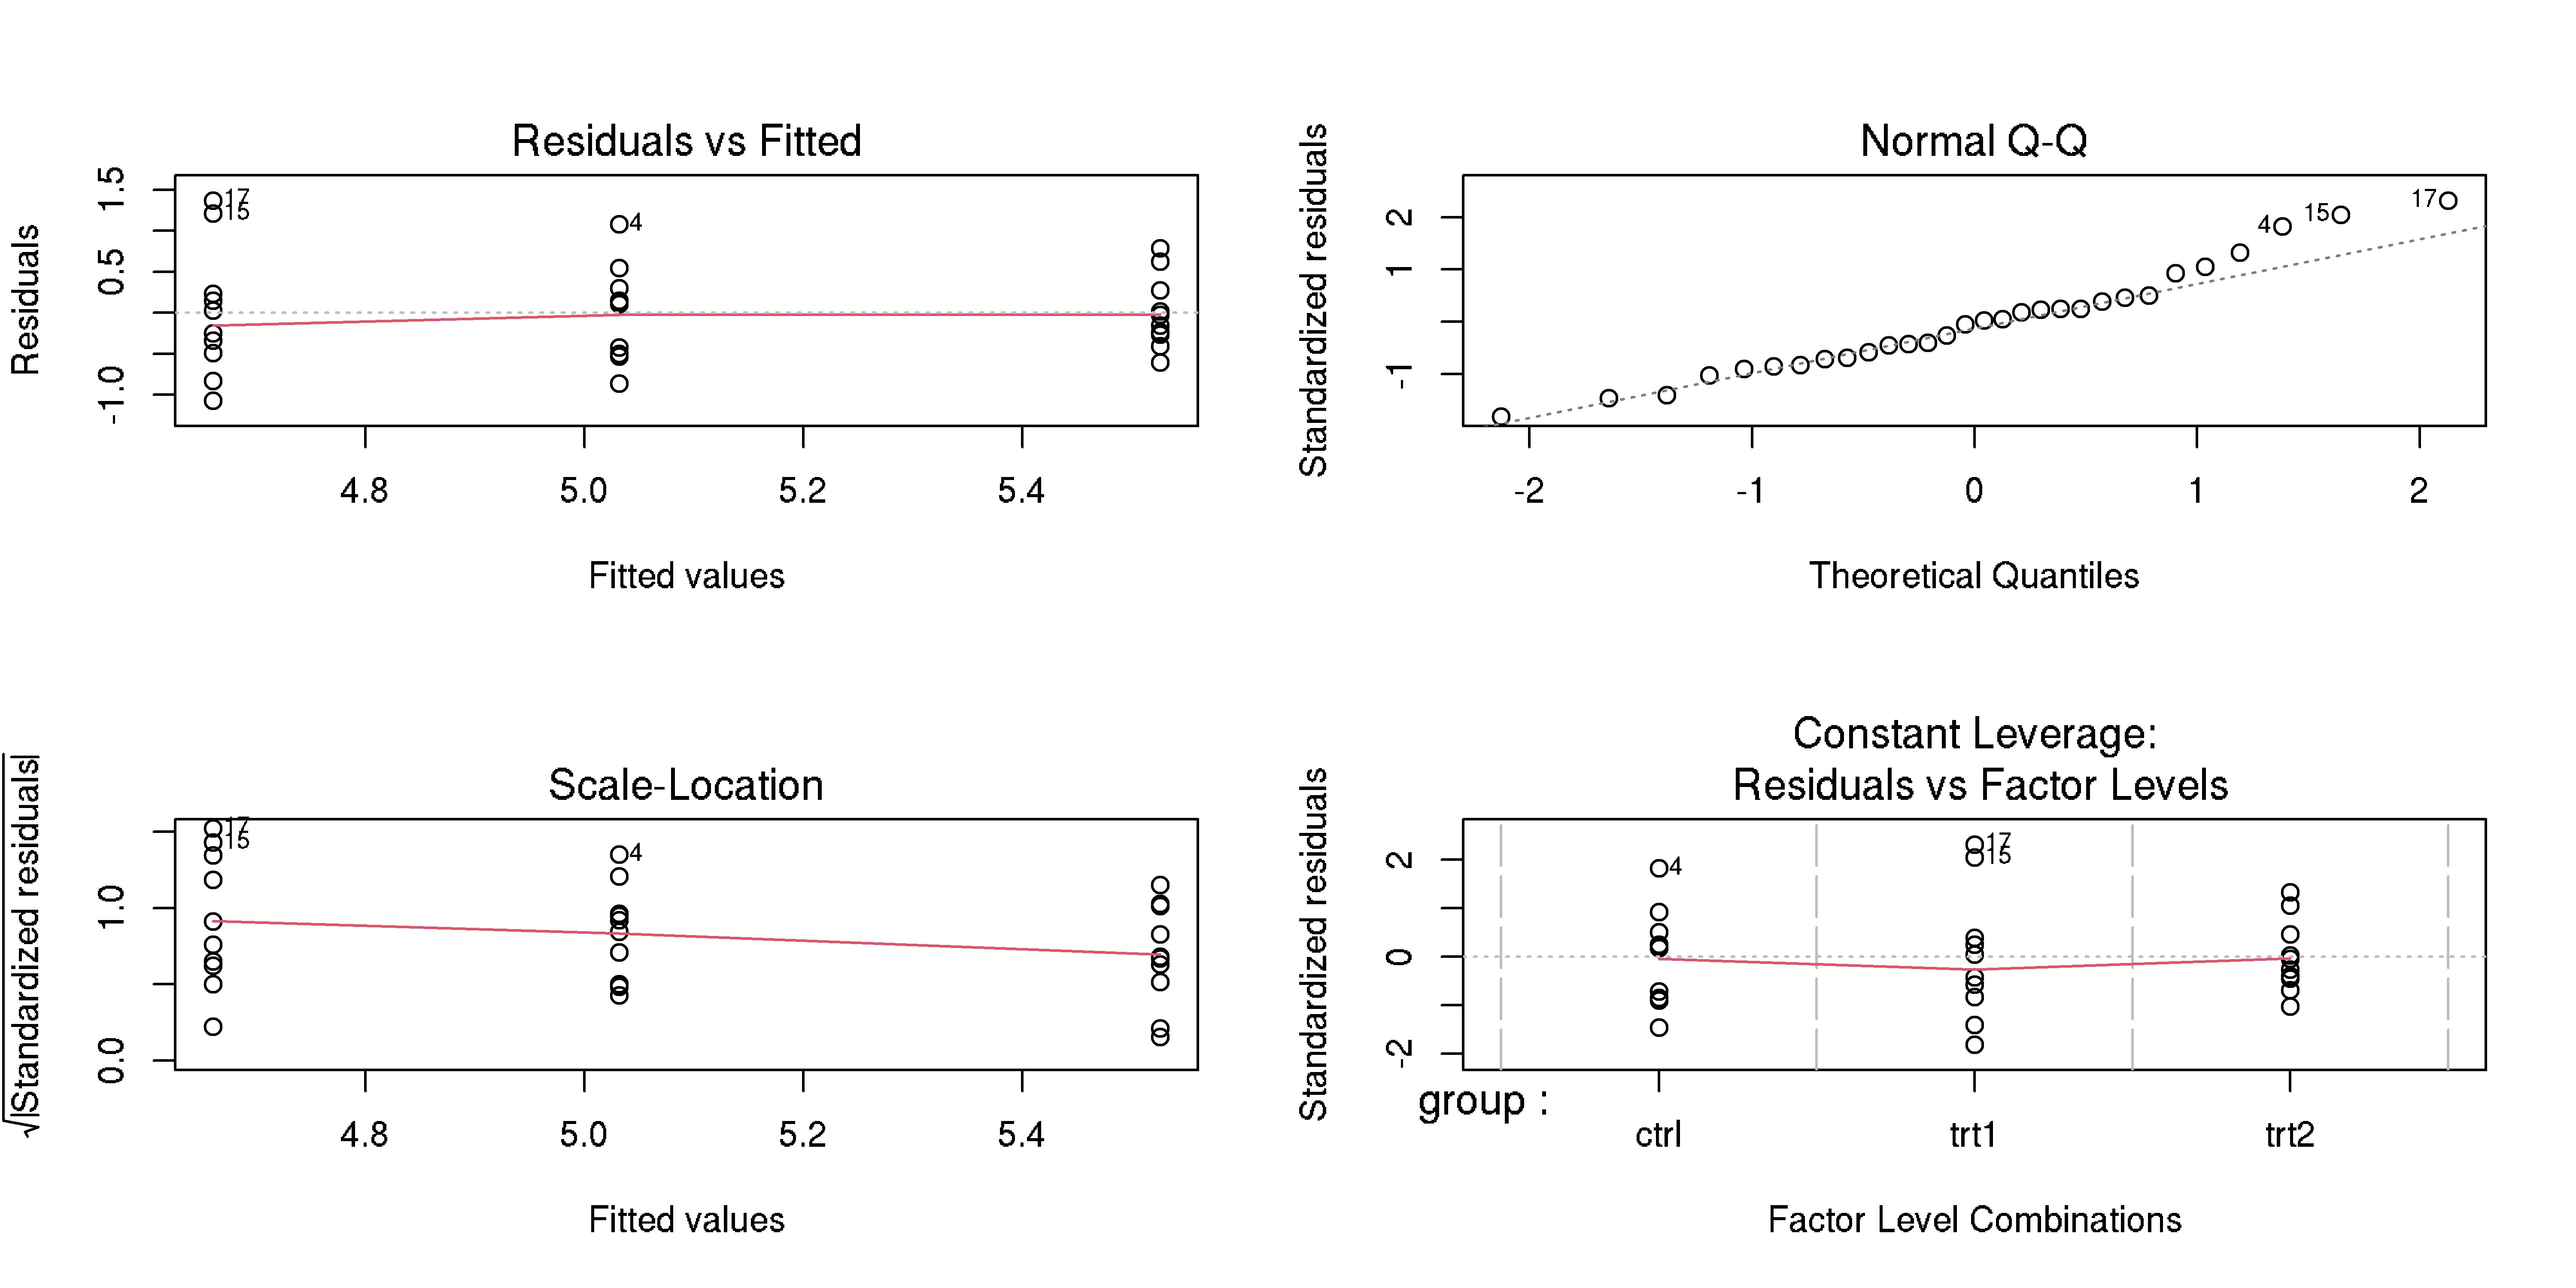
Example, please?
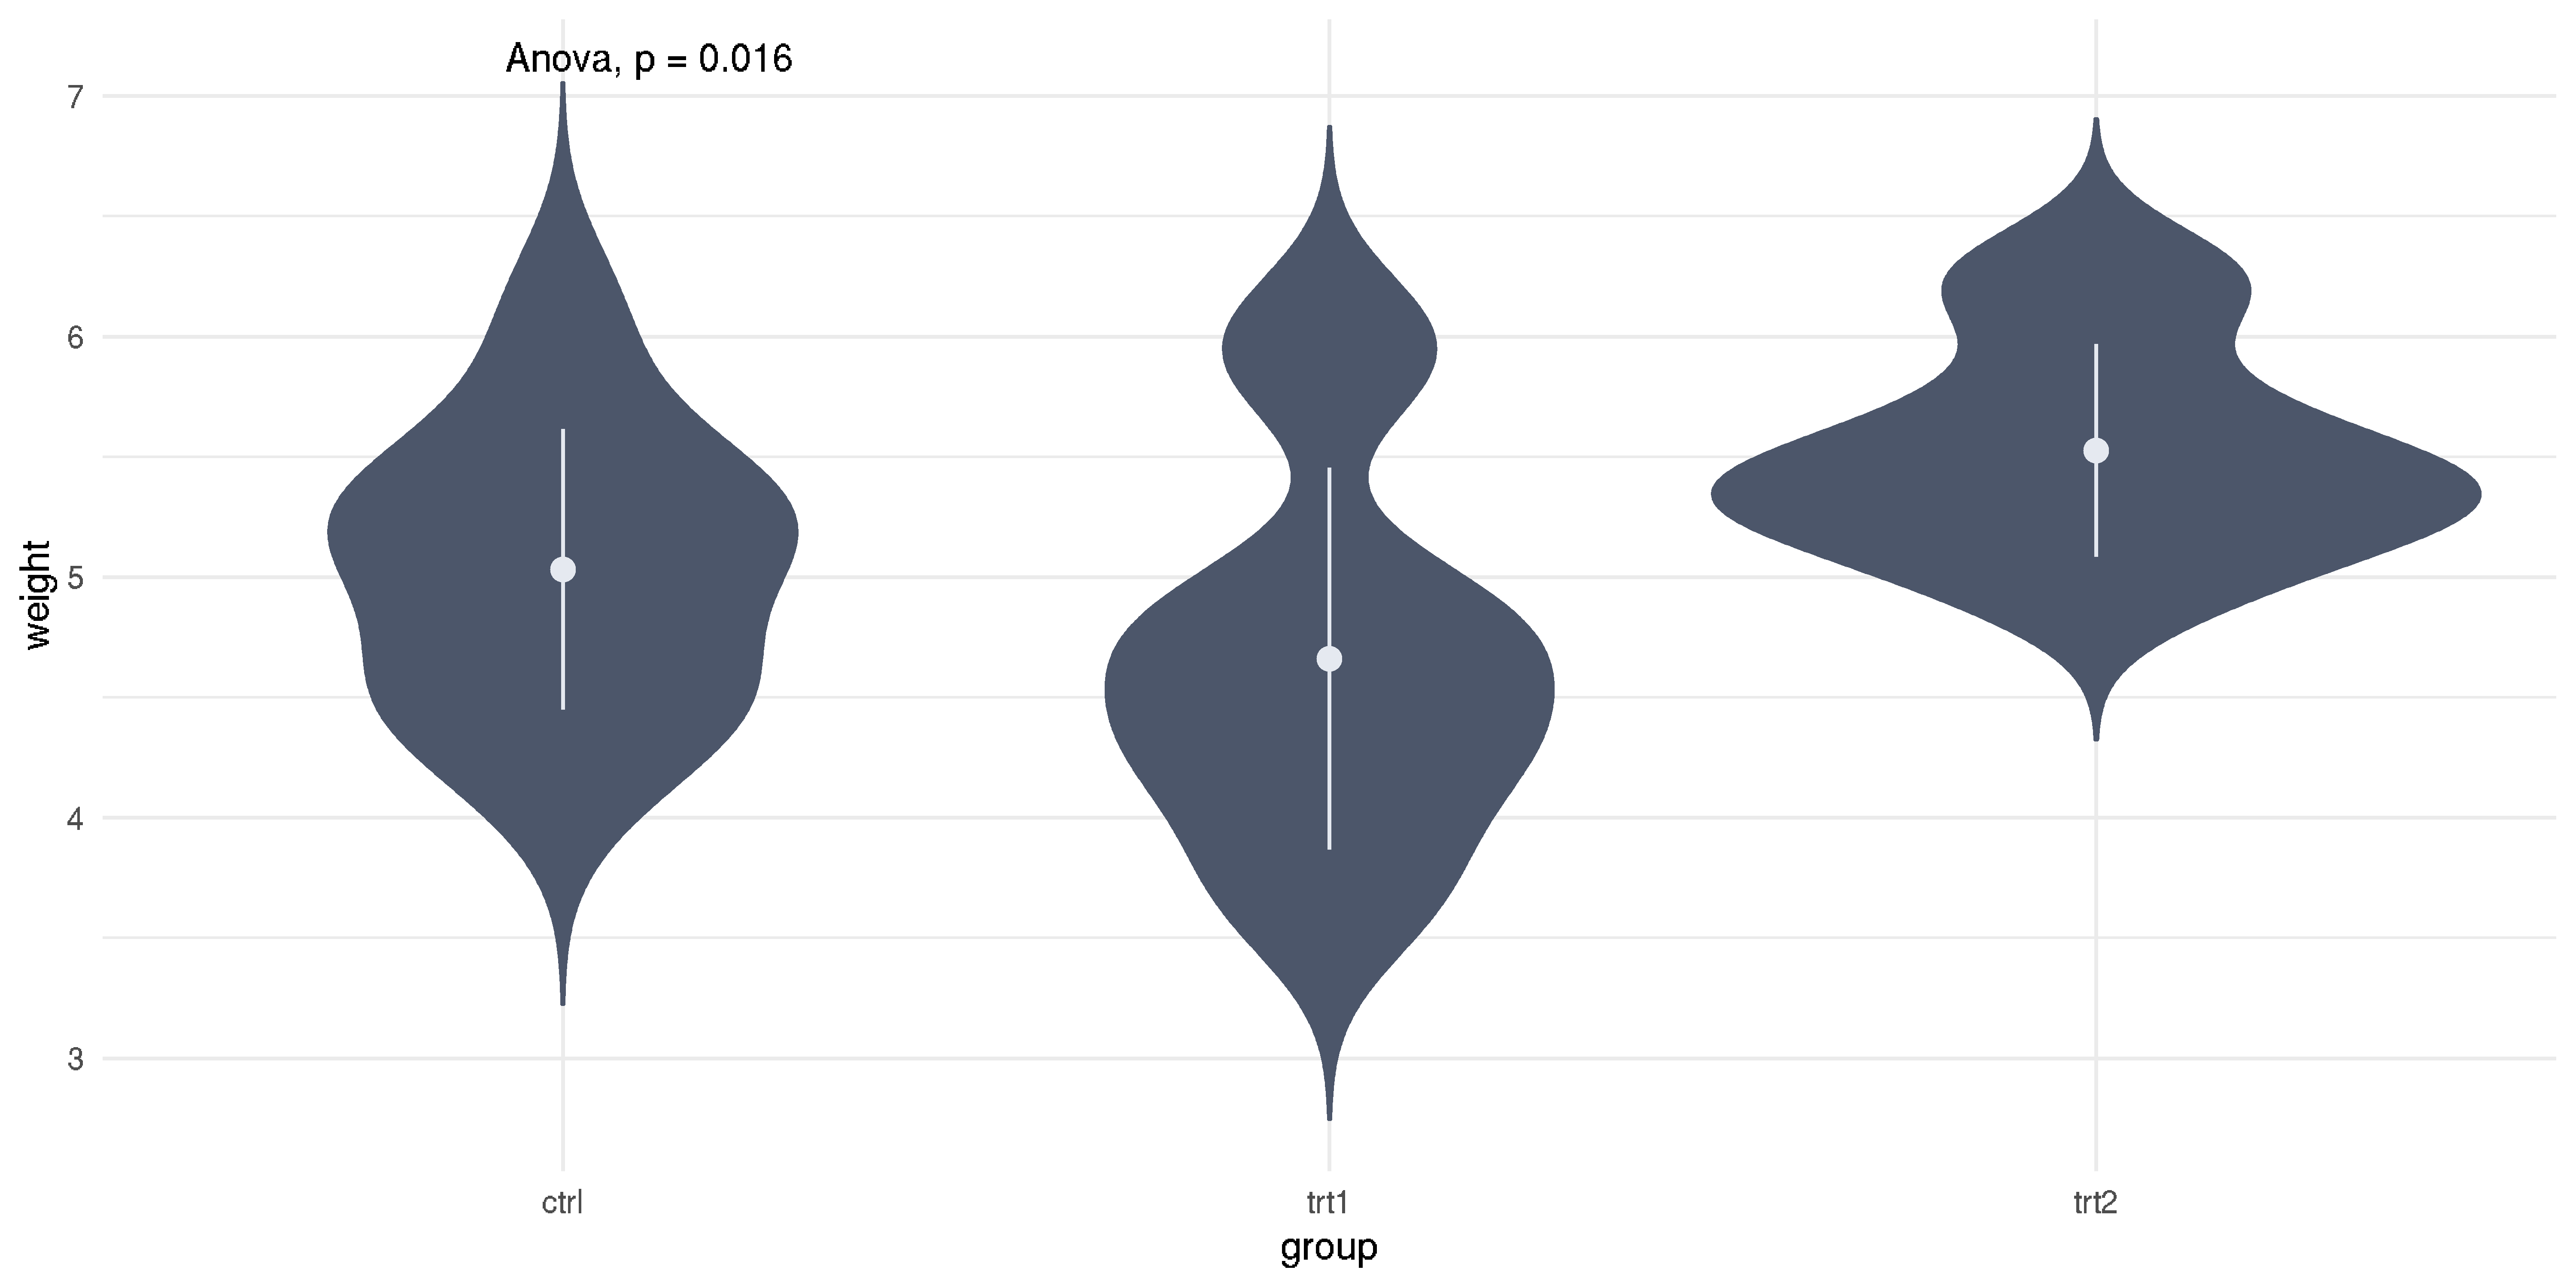
Steps to perform ANOVA
- Normality \(\to\) Shapiro-Wilk or Anderson-Darling test
- Homogeneity of variance \(\to\) Levene's test
- Do modelling and interpretation
- Check model goodness of fit
Overview
- One-way ANOVA
- Two-way ANOVA
- Repeated measure ANOVA
- Post-Hoc analysis
- Effect size
Two-Way ANOVA
- One-way ANOVA is enough, why two?
- Sometimes we want to consider other groups into our analysis
- We can also control for interaction among groups
- Two-way ANOVA often referred as factorial ANOVA
Two-Way ANOVA
- One-way ANOVA is enough, why two?
- Sometimes we want to consider other groups into our analysis
- We can also control for interaction among groups
- Two-way ANOVA often referred as factorial ANOVA
Assumptions
- I.I.D
- Normality
- Homogeneity of variance
Example, please?
- We will conduct the test using a dataset in
R - This data just happen to exist in JASP as well (give it a try!)
- Dataset
ToothGrowthhas three variables of:len: Tooth lengthsupp: Supplement givendose: Supplement dose
Example, please?
Initial inspection
# Data structurestr(ToothGrowth)## 'data.frame': 60 obs. of 3 variables:## $ len : num 4.2 11.5 7.3 5.8 6.4 10 11.2 11.2 5.2 7 ...## $ supp: Factor w/ 2 levels "OJ","VC": 2 2 2 2 2 2 2 2 2 2 ...## $ dose: num 0.5 0.5 0.5 0.5 0.5 0.5 0.5 0.5 0.5 0.5 ...# Set dose as a factorToothGrowth$dose %<>% factor(levels=c(0.5, 1.0, 2.0))Example, please?
Descriptive statistics
# Grouped by supplement typewith(ToothGrowth, tapply(len, supp, summary)) %>% {do.call(rbind, .)}## Min. 1st Qu. Median Mean 3rd Qu. Max.## OJ 8.2 15.5 22.7 20.7 25.7 30.9## VC 4.2 11.2 16.5 17.0 23.1 33.9# Grouped by prescribed dosewith(ToothGrowth, tapply(len, dose, summary)) %>% {do.call(rbind, .)}## Min. 1st Qu. Median Mean 3rd Qu. Max.## 0.5 4.2 7.22 9.85 10.6 12.2 21.5## 1 13.6 16.25 19.25 19.7 23.4 27.3## 2 18.5 23.53 25.95 26.1 27.8 33.9Example, please?
Normality test
# Grouped by supplement typewith(ToothGrowth, tapply(len, supp, shapiro.test)) %>% lapply(broom::tidy) %>% lapply(data.frame) %>% {do.call(rbind, .)}## statistic p.value method## OJ 0.918 0.0236 Shapiro-Wilk normality test## VC 0.966 0.4284 Shapiro-Wilk normality test# Grouped by prescribed dosewith(ToothGrowth, tapply(len, dose, shapiro.test)) %>% lapply(broom::tidy) %>% lapply(data.frame) %>% {do.call(rbind, .)}## statistic p.value method## 0.5 0.941 0.247 Shapiro-Wilk normality test## 1 0.931 0.164 Shapiro-Wilk normality test## 2 0.978 0.902 Shapiro-Wilk normality testExample, please?
Data in OJ is not normal, what to do?
Example, please?
Data in OJ is not normal, what to do?
Keep calm.
Example, please?
Data in OJ is not normal, what to do?
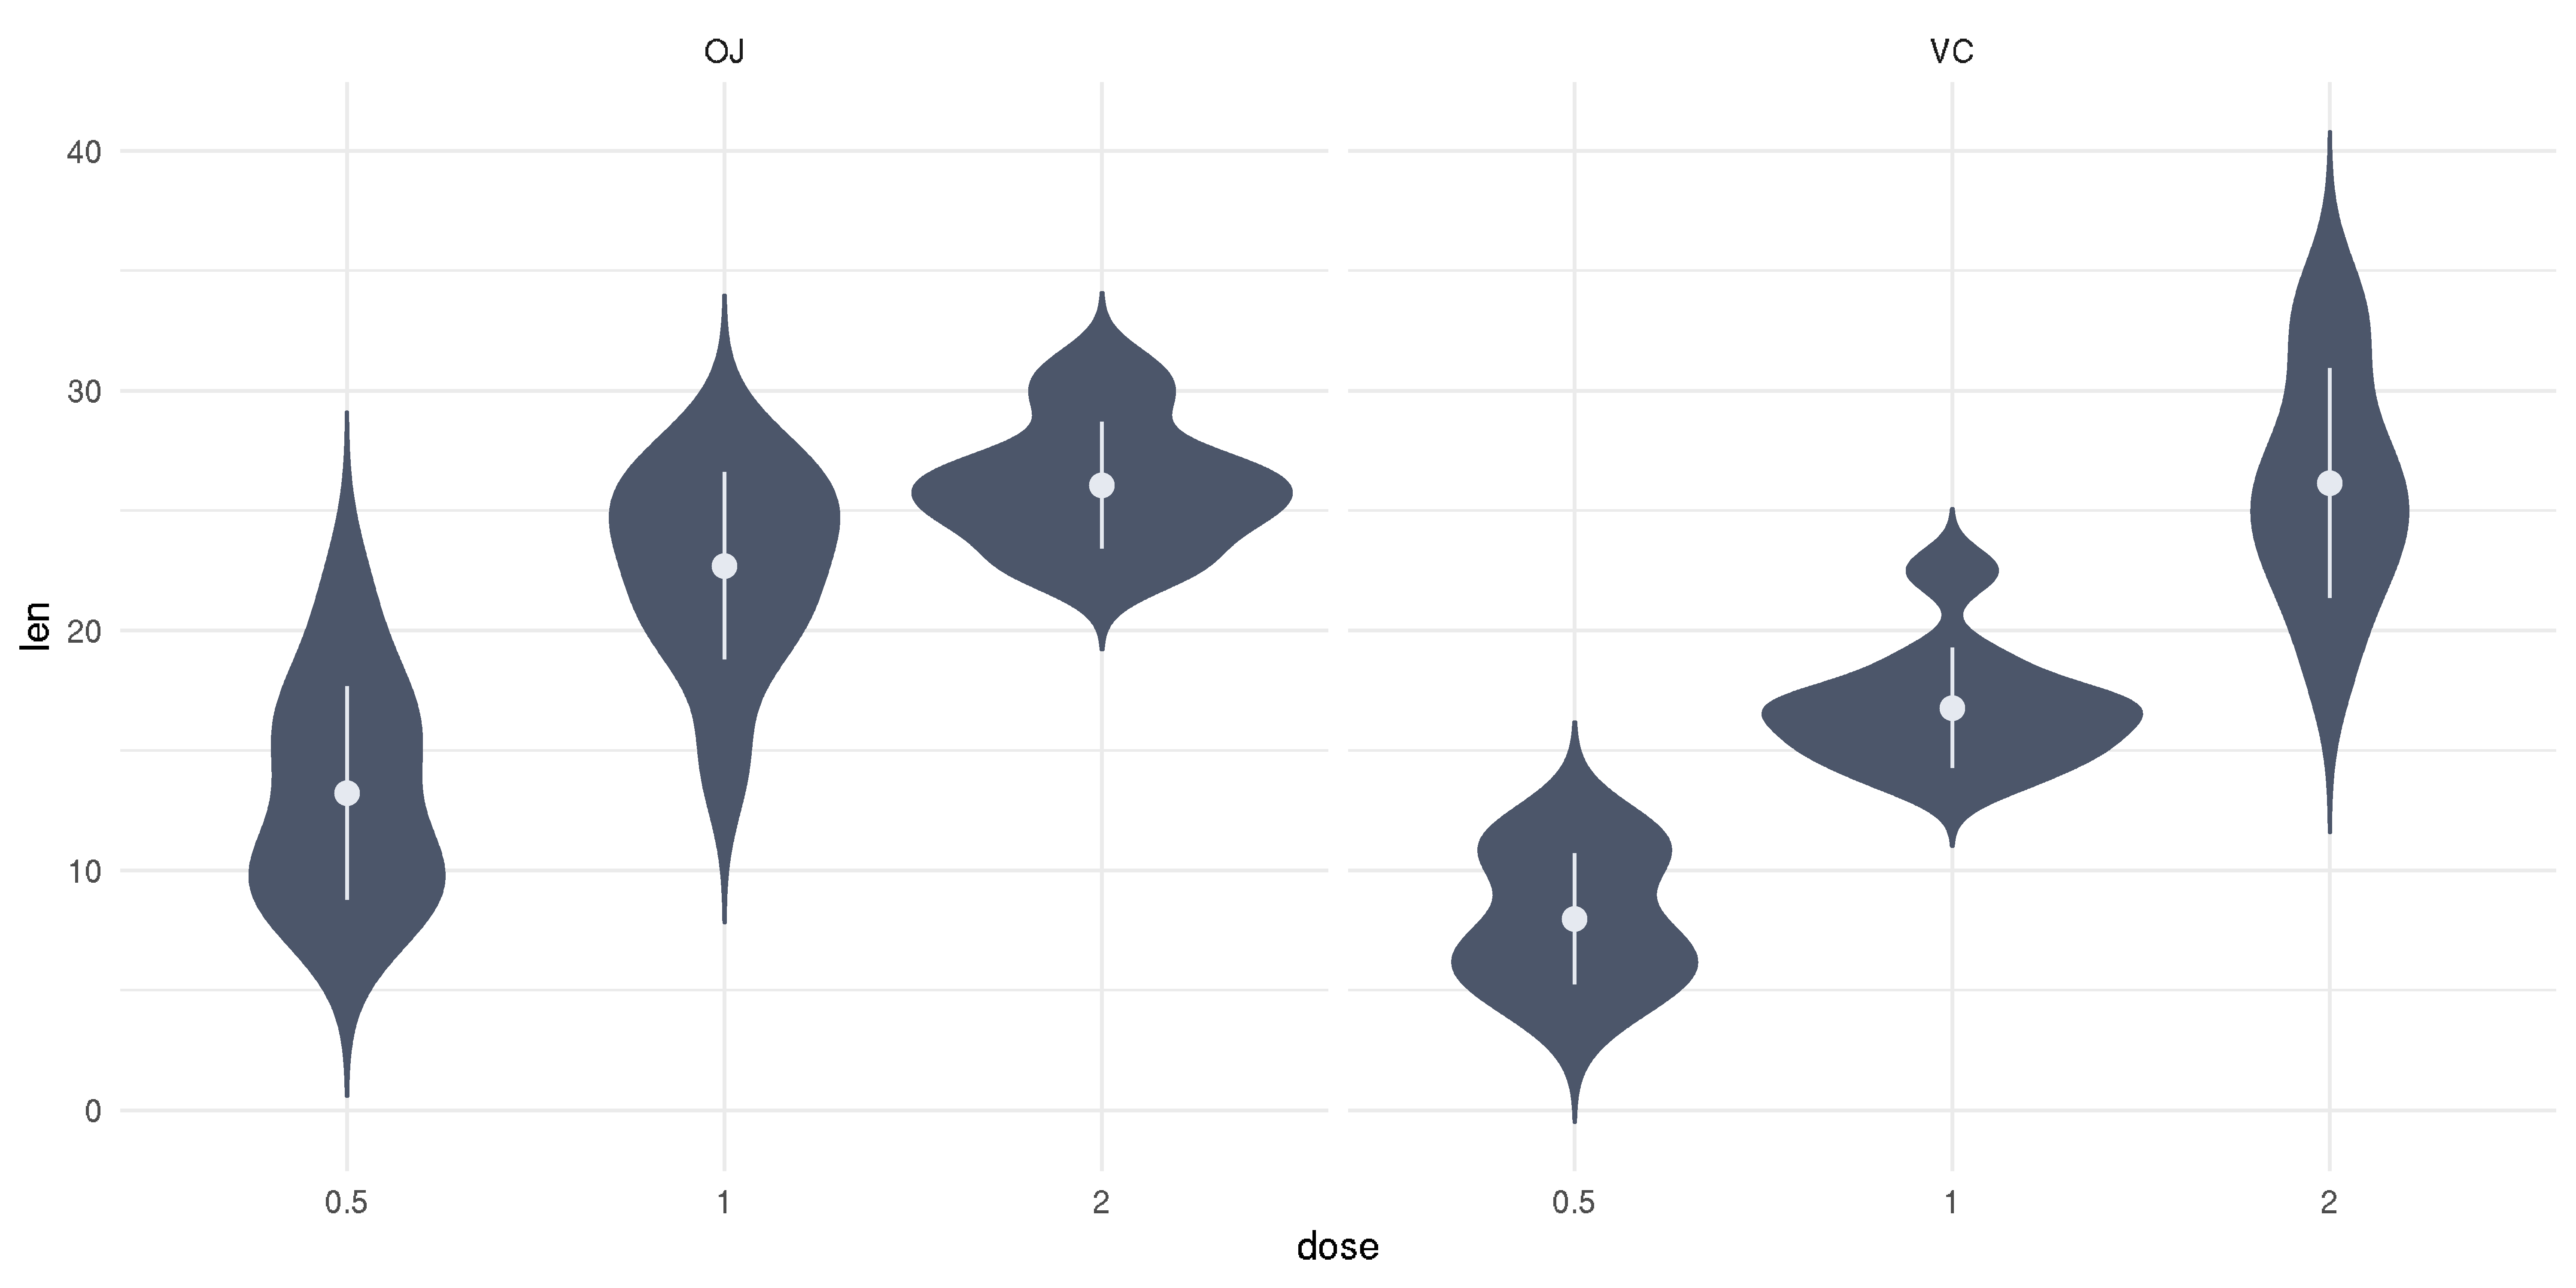
Keep calm. We can try a visual examination.
Example, please?
Data in OJ is not normal, what to do?
Keep calm. We can try a visual examination.
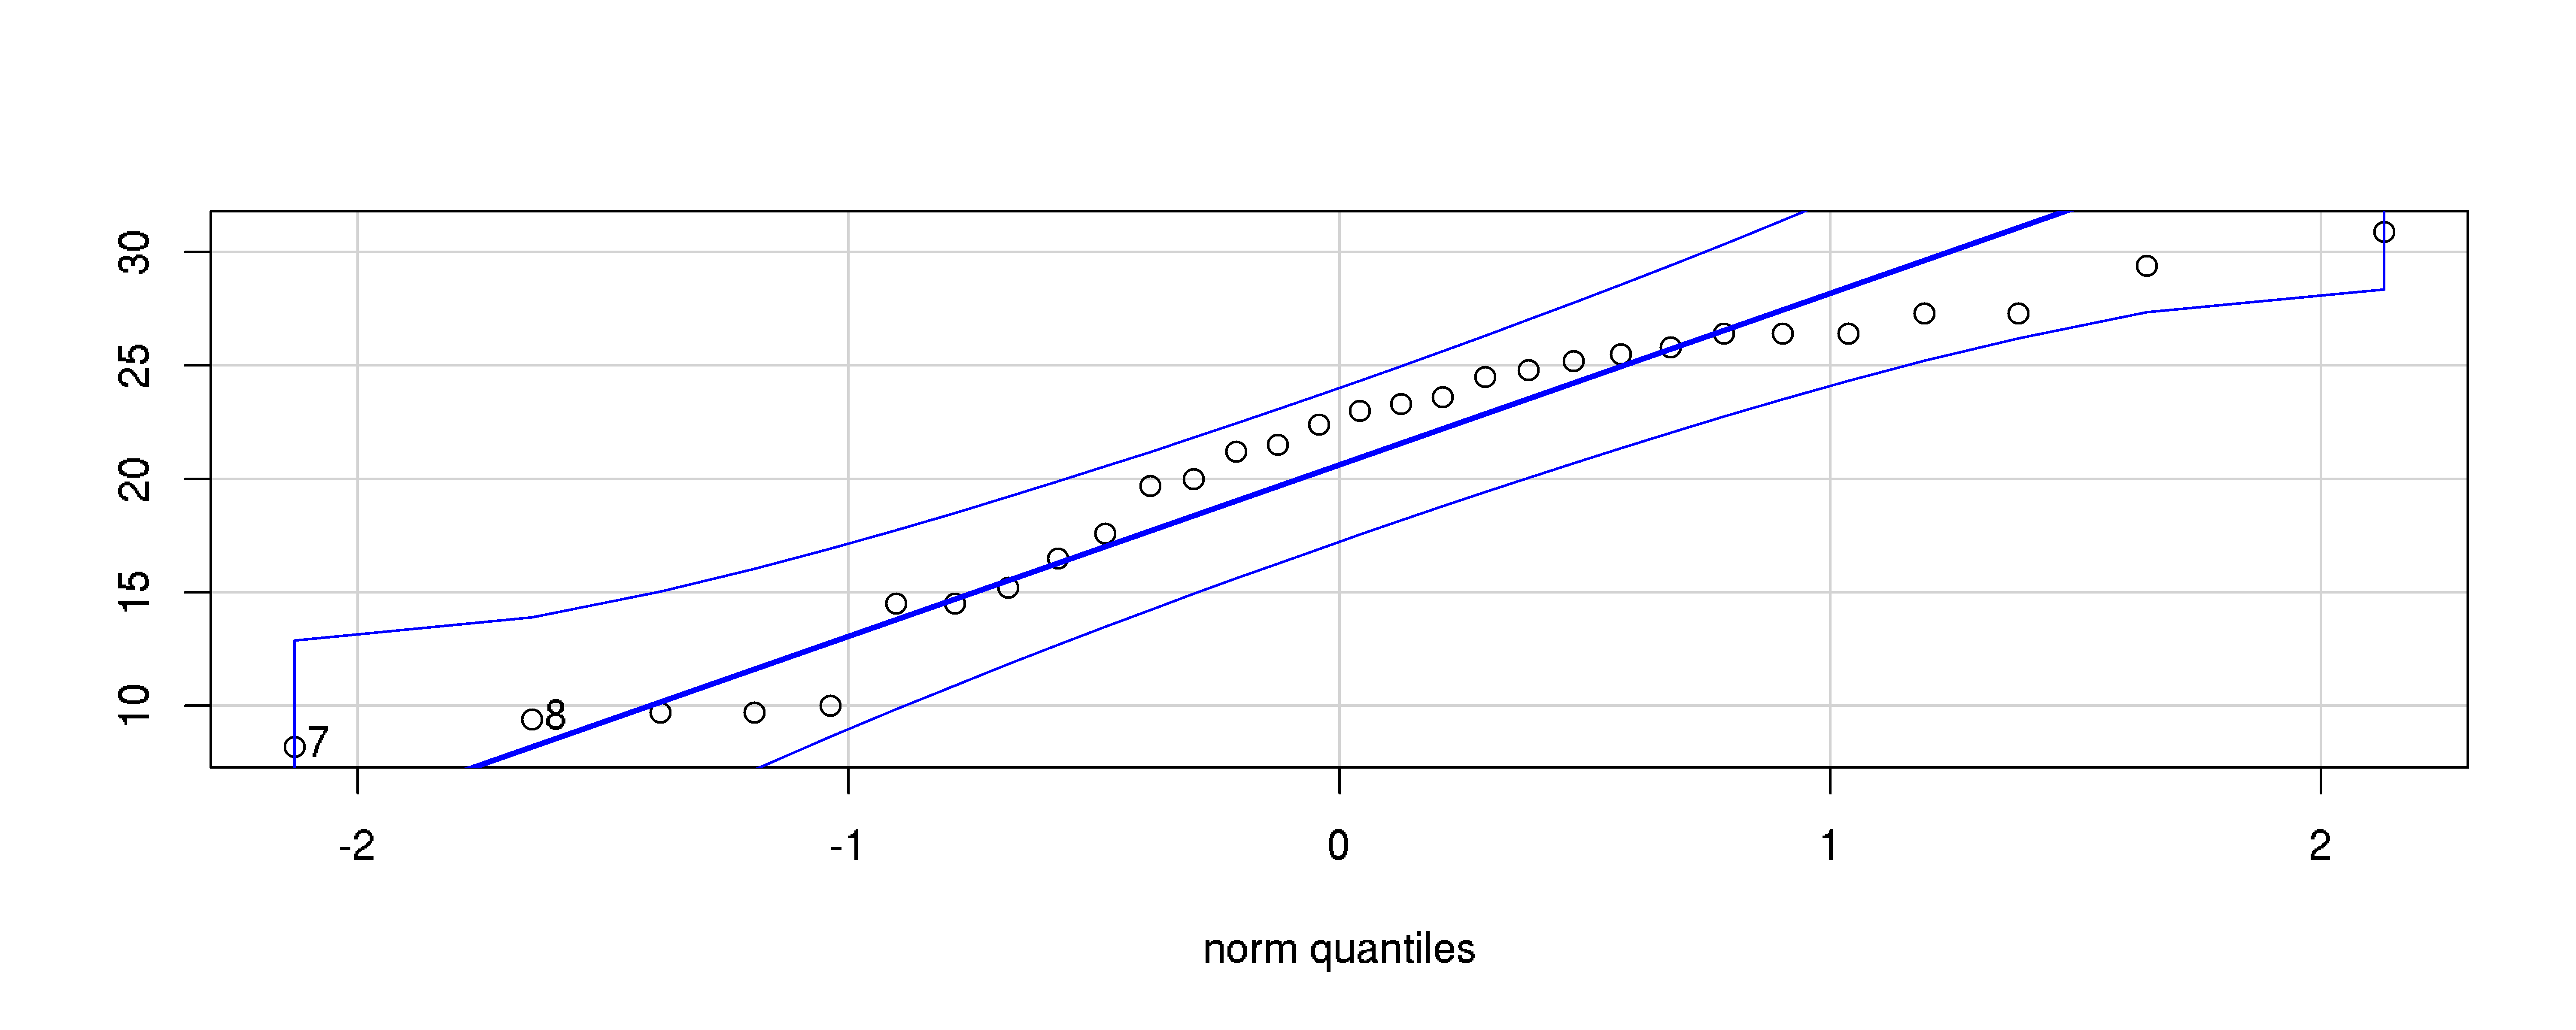
Example, please?
Homogeneity of variance
# Grouped by supplement typecar::leveneTest(len ~ supp, data=ToothGrowth)## Levene's Test for Homogeneity of Variance (center = median)## Df F value Pr(>F)## group 1 1.21 0.28## 58# Grouped by prescribed dosecar::leveneTest(len ~ dose, data=ToothGrowth)## Levene's Test for Homogeneity of Variance (center = median)## Df F value Pr(>F)## group 2 0.65 0.53## 57Example, please?
Conducting factorial ANOVA
aov.res2 <- aov(len ~ supp + dose, data=ToothGrowth)anova(aov.res2)## Analysis of Variance Table## ## Response: len## Df Sum Sq Mean Sq F value Pr(>F) ## supp 1 205 205 14.0 0.00043 ***## dose 2 2426 1213 82.8 < 2e-16 ***## Residuals 56 820 15 ## ---## Signif. codes: 0 '***' 0.001 '**' 0.01 '*' 0.05 '.' 0.1 ' ' 1Example, please?
Evaluate model goodness of fit
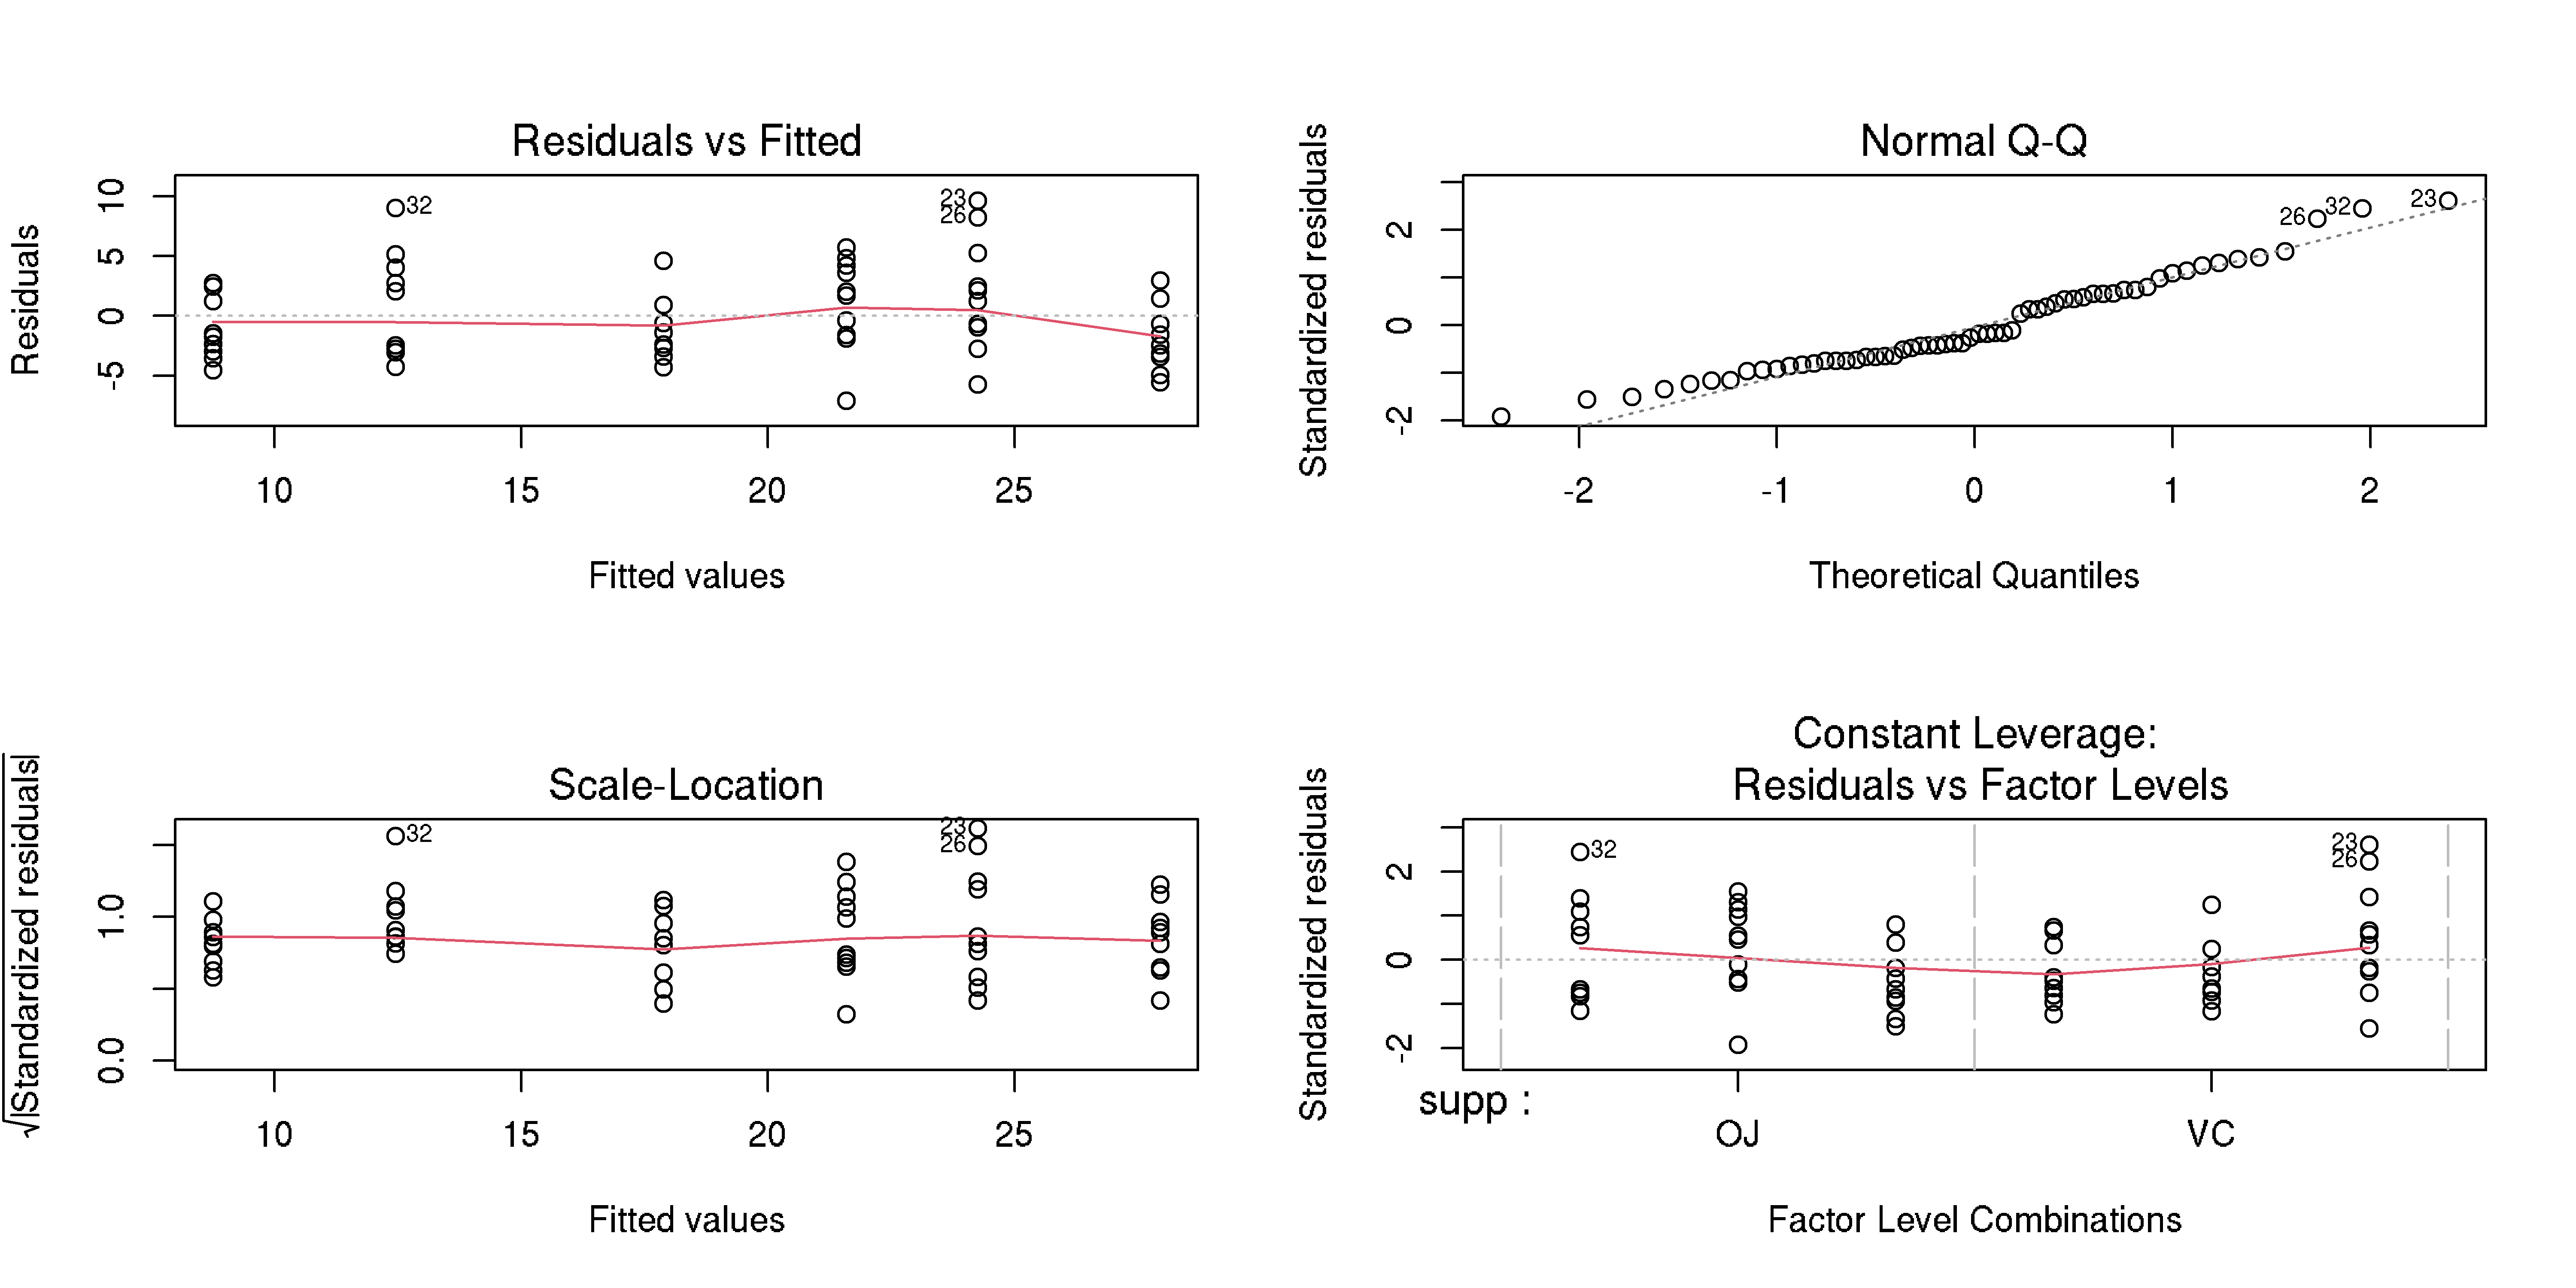
Example, please?
Overview
- One-way ANOVA
- Two-way ANOVA
- Repeated measure ANOVA
- Post-Hoc analysis
- Effect size
Repeated measure ANOVA
- An extension to paired T-Test
- As in the unpaired variant, we can perform one-way or factorial ANOVA
Repeated measure ANOVA
- An extension to paired T-Test
- As in the unpaired variant, we can perform one-way or factorial ANOVA
Assumptions
- Normality
- Sphericity \(\to\) Mauchly's test
- No extreme outlier
- Sphericity: homogeneity of between group differences variance
- Outlier: Q3 + 1.5 IQR (or Q1 - 1.5 IQR)
- Extreme point: Q3 + 3 IQR (or Q1 - 3 IQR)
Example, please?
- We are pretty much accustomed to measuring mean differences
- We also know how ANOVA works (practically)
- Now we shall use
ChickWeightdataset to apply repeated ANOVA
Example, please?
- We are pretty much accustomed to measuring mean differences
- We also know how ANOVA works (practically)
- Now we shall use
ChickWeightdataset to apply repeated ANOVA
What's in the data?
weight: chicken weight in gramsTime: number of days since birthChick: unique identifier on the chickenDiet: type of diet given
Example, please?
# Data structurestr(ChickWeight)## Classes 'nfnGroupedData', 'nfGroupedData', 'groupedData' and 'data.frame': 578 obs. of 4 variables:## $ weight: num 42 51 59 64 76 93 106 125 149 171 ...## $ Time : num 0 2 4 6 8 10 12 14 16 18 ...## $ Chick : Ord.factor w/ 50 levels "18"<"16"<"15"<..: 15 15 15 15 15 15 15 15 15 15 ...## $ Diet : Factor w/ 4 levels "1","2","3","4": 1 1 1 1 1 1 1 1 1 1 ...## - attr(*, "formula")=Class 'formula' language weight ~ Time | Chick## .. ..- attr(*, ".Environment")=<environment: R_EmptyEnv> ## - attr(*, "outer")=Class 'formula' language ~Diet## .. ..- attr(*, ".Environment")=<environment: R_EmptyEnv> ## - attr(*, "labels")=List of 2## ..$ x: chr "Time"## ..$ y: chr "Body weight"## - attr(*, "units")=List of 2## ..$ x: chr "(days)"## ..$ y: chr "(gm)"Example, please?
Data normality
with(ChickWeight, tapply(weight, Time, shapiro.test)) %>% lapply(broom::tidy) %>% lapply(data.frame) %>% {do.call(rbind, .)}## statistic p.value method## 0 0.890 2.22e-04 Shapiro-Wilk normality test## 2 0.873 6.86e-05 Shapiro-Wilk normality test## 4 0.973 3.15e-01 Shapiro-Wilk normality test## 6 0.982 6.48e-01 Shapiro-Wilk normality test## 8 0.980 5.77e-01 Shapiro-Wilk normality test## 10 0.981 6.16e-01 Shapiro-Wilk normality test## 12 0.983 6.86e-01 Shapiro-Wilk normality test## 14 0.973 3.25e-01 Shapiro-Wilk normality test## 16 0.986 8.30e-01 Shapiro-Wilk normality test## 18 0.991 9.75e-01 Shapiro-Wilk normality test## 20 0.991 9.68e-01 Shapiro-Wilk normality test## 21 0.986 8.69e-01 Shapiro-Wilk normality testExample, please?
Data normality
with(ChickWeight, tapply(weight, Time, shapiro.test)) %>% lapply(broom::tidy) %>% lapply(data.frame) %>% {do.call(rbind, .)}## statistic p.value method## 0 0.890 2.22e-04 Shapiro-Wilk normality test## 2 0.873 6.86e-05 Shapiro-Wilk normality test## 4 0.973 3.15e-01 Shapiro-Wilk normality test## 6 0.982 6.48e-01 Shapiro-Wilk normality test## 8 0.980 5.77e-01 Shapiro-Wilk normality test## 10 0.981 6.16e-01 Shapiro-Wilk normality test## 12 0.983 6.86e-01 Shapiro-Wilk normality test## 14 0.973 3.25e-01 Shapiro-Wilk normality test## 16 0.986 8.30e-01 Shapiro-Wilk normality test## 18 0.991 9.75e-01 Shapiro-Wilk normality test## 20 0.991 9.68e-01 Shapiro-Wilk normality test## 21 0.986 8.69e-01 Shapiro-Wilk normality testHmm.. Data in \(t_0\) and \(t_2\) does not seem right
Option:
- Transformation: standardization, normalization
- Filter and delete rows
Example, please?
tbl <- subset(ChickWeight, subset=!{ChickWeight$Time==0 | ChickWeight$Time==2})with(tbl, tapply(weight, Time, shapiro.test)) %>% lapply(broom::tidy) %>% lapply(data.frame) %>% {do.call(rbind, .)}## statistic p.value method## 4 0.973 0.315 Shapiro-Wilk normality test## 6 0.982 0.648 Shapiro-Wilk normality test## 8 0.980 0.577 Shapiro-Wilk normality test## 10 0.981 0.616 Shapiro-Wilk normality test## 12 0.983 0.686 Shapiro-Wilk normality test## 14 0.973 0.325 Shapiro-Wilk normality test## 16 0.986 0.830 Shapiro-Wilk normality test## 18 0.991 0.975 Shapiro-Wilk normality test## 20 0.991 0.968 Shapiro-Wilk normality test## 21 0.986 0.869 Shapiro-Wilk normality testExample, please?
tbl <- subset(ChickWeight, subset=!{ChickWeight$Time==0 | ChickWeight$Time==2})with(tbl, tapply(weight, Time, shapiro.test)) %>% lapply(broom::tidy) %>% lapply(data.frame) %>% {do.call(rbind, .)}## statistic p.value method## 4 0.973 0.315 Shapiro-Wilk normality test## 6 0.982 0.648 Shapiro-Wilk normality test## 8 0.980 0.577 Shapiro-Wilk normality test## 10 0.981 0.616 Shapiro-Wilk normality test## 12 0.983 0.686 Shapiro-Wilk normality test## 14 0.973 0.325 Shapiro-Wilk normality test## 16 0.986 0.830 Shapiro-Wilk normality test## 18 0.991 0.975 Shapiro-Wilk normality test## 20 0.991 0.968 Shapiro-Wilk normality test## 21 0.986 0.869 Shapiro-Wilk normality testNow that looks better
Example, please?
Checking extreme outliers
# Use `weight` variable as a reference to identify outliersrstatix::identify_outliers(tbl, variable="weight")## weight Time Chick Diet is.outlier is.extreme## 1 331 21 21 2 TRUE FALSE## 2 327 20 34 3 TRUE FALSE## 3 341 21 34 3 TRUE FALSE## 4 332 18 35 3 TRUE FALSE## 5 361 20 35 3 TRUE FALSE## 6 373 21 35 3 TRUE FALSE## 7 321 21 40 3 TRUE FALSE## 8 322 21 48 4 TRUE FALSEExample, please?
Checking extreme outliers
# Use `weight` variable as a reference to identify outliersrstatix::identify_outliers(tbl, variable="weight")## weight Time Chick Diet is.outlier is.extreme## 1 331 21 21 2 TRUE FALSE## 2 327 20 34 3 TRUE FALSE## 3 341 21 34 3 TRUE FALSE## 4 332 18 35 3 TRUE FALSE## 5 361 20 35 3 TRUE FALSE## 6 373 21 35 3 TRUE FALSE## 7 321 21 40 3 TRUE FALSE## 8 322 21 48 4 TRUE FALSEOutliers exist, but none is extreme. Safe to proceed!
Example, please?
Perform repeated measure one-way ANOVA
rstatix::anova_test(data=tbl, dv=weight, wid=Chick, within=Time)## ANOVA Table (type III tests)## ## $ANOVA## Effect DFn DFd F p p<.05 ges## 1 Time 9 396 196 8.03e-140 * 0.617## ## $`Mauchly's Test for Sphericity`## Effect W p p<.05## 1 Time 6.67e-13 1.48e-209 *## ## $`Sphericity Corrections`## Effect GGe DF[GG] p[GG] p[GG]<.05 HFe DF[HF] p[HF]## 1 Time 0.136 1.22, 53.7 3.46e-21 * 0.137 1.24, 54.43 1.92e-21## p[HF]<.05## 1 *Example, please?
Perform repeated measure factorial ANOVA
rstatix::anova_test(data=tbl, dv=weight, wid=Chick, within=Time, between=Diet)## ANOVA Table (type III tests)## ## $ANOVA## Effect DFn DFd F p p<.05 ges## 1 Diet 3 41 5.01 5.00e-03 * 0.185## 2 Time 9 369 234.20 1.21e-146 * 0.685## 3 Diet:Time 27 369 3.52 2.77e-08 * 0.089## ## $`Mauchly's Test for Sphericity`## Effect W p p<.05## 1 Time 8.13e-13 1.97e-190 *## 2 Diet:Time 8.13e-13 1.97e-190 *## ## $`Sphericity Corrections`## Effect GGe DF[GG] p[GG] p[GG]<.05 HFe DF[HF] p[HF]## 1 Time 0.14 1.26, 51.64 9.97e-23 * 0.142 1.28, 52.51 4.53e-23## 2 Diet:Time 0.14 3.78, 51.64 1.40e-02 * 0.142 3.84, 52.51 1.40e-02## p[HF]<.05## 1 *## 2 *Lesson learnt
- Assumptions to fulfill
- Differences between one-way and factorial ANOVA
- Repeated measure: in case of violation in independency
- Assumptions: normality, homogeneity of variance, sphericity (in case repeated measures)
- Good practice: check for outliers and extreme points
Overview
- One-way ANOVA
- Two-way ANOVA
- Repeated measure ANOVA
- Post-Hoc analysis
- Effect size
Post-Hoc test
- Definition?
- Why post-hoc test?
- What type of test to consider?
- Any further assumption?
- In the original \(H_ a\), we did not assume which mean differences may reject the \(H_0\)
- Post-hoc test aims to measure pairwise difference from assigned groups
- Important to see which one contributed to \(H_0\) rejection
Tukey's Honestly Significant Difference
- Often abbreviated as the Tukey's HSD test or Tukey's range test
- Measure pairwise differences after conducting ANOVA
- Why not use two-sample T-Test?
- Offer protection against type-I error inflation
- More comparison \(\to\) higher chance of having a statistical error in ANOVA
- Tukey's HSD adjust the critical value based on the number of groups assigned
- Meaning that, with more group Tukey's will find it harder to produce a significant p-value
Example, please?
aov.res1 %>% anova() %>% broom::tidy()## # A tibble: 2 x 6## term df sumsq meansq statistic p.value## <chr> <int> <dbl> <dbl> <dbl> <dbl>## 1 group 2 3.77 1.88 4.85 0.0159## 2 Residuals 27 10.5 0.389 NA NATukeyHSD(aov.res1) %>% broom::tidy()## # A tibble: 3 x 7## term contrast null.value estimate conf.low conf.high adj.p.value## <chr> <chr> <dbl> <dbl> <dbl> <dbl> <dbl>## 1 group trt1-ctrl 0 -0.371 -1.06 0.320 0.391 ## 2 group trt2-ctrl 0 0.494 -0.197 1.19 0.198 ## 3 group trt2-trt1 0 0.865 0.174 1.56 0.0120Example, please?
aov.res2 %>% anova() %>% broom::tidy()## # A tibble: 3 x 6## term df sumsq meansq statistic p.value## <chr> <int> <dbl> <dbl> <dbl> <dbl>## 1 supp 1 205. 205. 14.0 4.29e- 4## 2 dose 2 2426. 1213. 82.8 1.87e-17## 3 Residuals 56 820. 14.7 NA NATukeyHSD(aov.res2) %>% broom::tidy()## # A tibble: 4 x 7## term contrast null.value estimate conf.low conf.high adj.p.value## <chr> <chr> <dbl> <dbl> <dbl> <dbl> <dbl>## 1 supp VC-OJ 0 -3.7 -5.68 -1.72 4.29e- 4## 2 dose 1-0.5 0 9.13 6.22 12.0 1.32e- 9## 3 dose 2-0.5 0 15.5 12.6 18.4 7.31e-12## 4 dose 2-1 0 6.37 3.45 9.28 6.98e- 6Overview
- One-way ANOVA
- Two-way ANOVA
- Repeated measure ANOVA
- Post-Hoc analysis
- Effect size
Effect size
- Concept recall: Cohen's \(d\)
- \(d\) is limited to measure distance in a two-sample mean difference
- ANOVA requires something more general
- Solution: Eta-square \(\eta^2\)
Effect size
- Concept recall: Cohen's \(d\)
- \(d\) is limited to measure distance in a two-sample mean difference
- ANOVA requires something more general
- Solution: Eta-square \(\eta^2\)
\begin{align} \eta^2 &= \frac{SS_{effect}}{SS_{total}} \\ Partial\ \eta^2 &= \frac{SS_{effect}}{SS_{effect} + SS_{error}} \end{align}
- \(\eta^2\): in ANOVA
- Partial \(\eta^2\): in repeated-measure ANOVA
Example, please?
heplots::etasq(aov.res1, partial=FALSE)## eta^2## group 0.264## Residuals NAheplots::etasq(aov.res2, partial=FALSE)## eta^2## supp 0.0595## dose 0.7029## Residuals NAPower analysis
pwr::pwr.anova.test(k=3, n=10, f=0.264)## ## Balanced one-way analysis of variance power calculation ## ## k = 3## n = 10## f = 0.264## sig.level = 0.05## power = 0.213## ## NOTE: n is number in each groupPower analysis
pwr::pwr.anova.test(k=2, n=30, f=0.0595)## ## Balanced one-way analysis of variance power calculation ## ## k = 2## n = 30## f = 0.0595## sig.level = 0.05## power = 0.0739## ## NOTE: n is number in each groupPower analysis
pwr::pwr.anova.test(k=3, n=20, f=0.7029)## ## Balanced one-way analysis of variance power calculation ## ## k = 3## n = 20## f = 0.703## sig.level = 0.05## power = 0.999## ## NOTE: n is number in each groupQuery?